

This article shares our experience in addressing the impact the OVH data centers fire had on our monitoring infrastructure and lessons learned.
Our monitoring system at large
First of all, let me say a few words about how we monitor customers’ applications and the infrastructure as a whole. For this, we use three different types of monitoring:
- Blackbox monitoring for checking the status of web resources. Its objective is to collect statistics from specific endpoints and check their health based on certain conditions. For example, these endpoints can be a JSON page containing the health status of all the crucial infrastructure elements or specific website pages. This type of monitoring is the most critical one since it monitors the performance of the customers’ site/services for its users. On the technical side, the blackbox monitoring sends requests of various complexity over HTTP/HTTPS. The user can control the page size and its contents and parse JSON output (this feature is often used to render status pages for applications). The blackbox monitoring is distributed between different geographical zones to ensure fault tolerance. This monitoring was not affected by the incident thanks to geo-distribution (besides, it runs outside the OVH infrastructure).
- Monitoring of the Kubernetes infrastructure and customer applications running on it. On the technical side, this type of monitoring is implemented using the Prometheus + Grafana + Alertmanager bundle that is installed locally in K8s clusters. Part of the data collected with this monitoring system (e.g., Kubernetes and Deckhouse-related metrics) is sourced to our shared system, while the other part can be sent optionally (e.g., for monitoring applications and reactions by engineers on duty).
- Monitoring of resources that are outside Kubernetes clusters. These resources can include bare-metal servers, virtual machines, and DBMS running on them. We use a third-party service to cover this type of monitoring. It was this service that suffered a deadly blow from the OVH incident.
Thus, all the challenges described below are related to the unavailability of just one of the systems we use — the abovementioned third-party service. We lost information about some infrastructure components (outside of the Kubernetes clusters) for a while. At the same time, the blackbox monitoring was running fine; therefore, we could see that the main business functions were operating normally.
How did we handle this incident? What steps did we take during the incident? And what steps did we take after the incident?
The first signs of an incident
We verify the availability of external monitoring tools using the so-called Dead Man’s Switch (DMS) approach. In some sense, this approach works upside down:
- The system creates a fake OK alert meaning that everything is OK, and continuously sends it from local monitoring tools (Prometheus, third-party service, etc.) to our incident management system.
- The fake OK alert is active as long as everything is fine with the monitoring tools (but our system does not show it).
- When there are problems, the OK alert ceases to be active, leading to the ERROR alert. The latter signals that monitoring fails to work properly. And then our engineers respond to it.
This approach is highly effective in situations similar to the one that occurred on March 10th (the OVH fire): the first alert about the problem (ERROR) was issued by the DMS system.
The events unfolded as follows:
- The first indication of the problem came in the form of a DMS alert at approximately 1:20 AM (in the UTC+1 timezone).
- We contacted third-party service support and found out that they were experiencing problems with the hosting data center. However, no detailed information was available at the time, so we could not assess the scale of the incident. Also, the engineer on duty confirmed that our other monitoring tools (blackbox & Kubernetes) run normally. Thus, we decided to leave the situation “as is” until the morning.
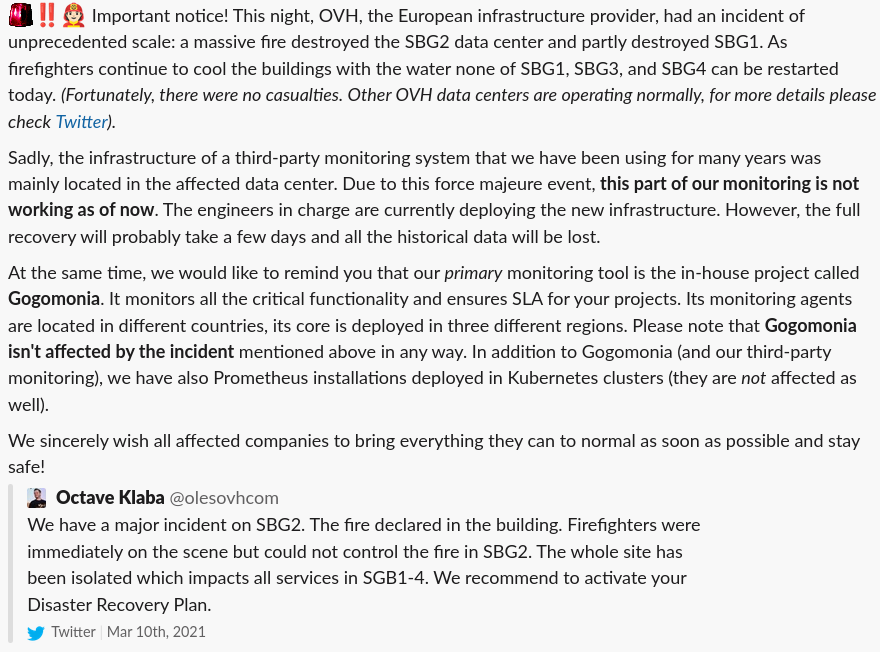
- At 6:14 AM, we learned that the fire destroyed the data center, and the service had to move its infrastructure to another data center. It will remain unavailable until the migration is complete.
Now, let me say a few words about how the external monitoring service infrastructure was organized. Its primary components were hosted in the following two OVH data centers:
- SBG-2 — the fire destroyed this one;
- SBG-1 — this one was partially damaged and powered down.
In other words, two formally independent OVH data centers happened to be in neighboring buildings. The fire that broke out in the first building soon spread to the second one.
Based on this information, we concluded that the third-party service functionality essential to us must be replaced with some temporary solutions as soon as possible.
First steps
First of all, we created a rapid response (RR) team with the following objectives:
- Determine the scale of the incident;
- Create a step-by-step plan for dealing with the consequences of the incident;
- Implement decisions that were made.
The RR team included the leaders of our DevOps teams, engineers of the platform team, and the company’s CTO. Later, we added additional engineers there – they helped us develop and test new tools that replaced those in the third-party service.
As I said, we used an external service as one of the monitoring tools. Let’s find out what role it played in the overall system. How critical was it? We use the following matrix to determine the seriousness of alerts:
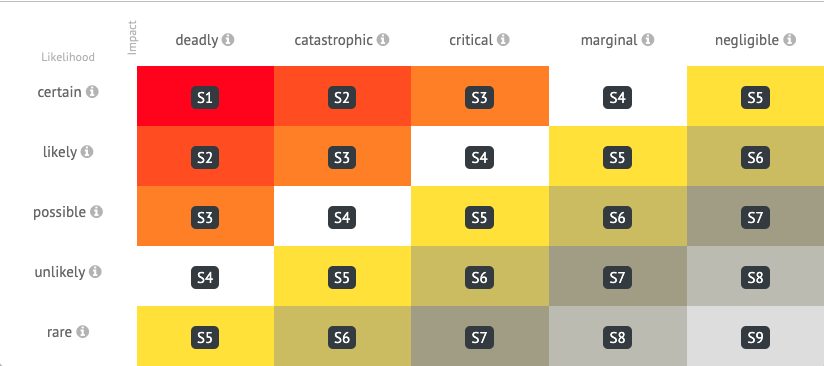
This matrix applies to alerts from all three monitoring systems we use. Each incident (originating in any monitoring system) is assigned the criticality level starting with S1 (the most severe) and up to S9 (diagnostic information). Most S1 alerts originate in the blackbox monitoring system (again, it checks customer websites). However, this category also includes some alerts generated by the third-party service (see below for more info). Another small part of those alerts belongs to the S2 category, and all the rest have a lower criticality (S3 or below).
We analyzed the number/specifics of S1 and S2 alerts generated by the third-party service and decided to deal with them in the first place by using a temporary solution. After that, we could take care of the less critical alerts.
We notified all the customers whose infrastructure was affected by the external service incident and started drawing up a recovery plan.
Recovery plan
First stage: restoring S1 & S2 alerts
First of all, we had to determine which critical alerts stopped being generated after the external service failure. To do this, each team that used third-party monitoring gathered statistics on the number of alerts coming from there by severity type, starting with June 1, 2020.
It turned out that the most critical alerts fall into the following categories:
- Various DBMS-related alerts;
- Checking the health of the DBMS in general (does the process run?).
- Replication status.
- The status of the database requests (e.g., the number of pending requests).
- Disk space on virtual machines.
- The general availability of virtual machines.
Second stage: restoring S3 and less critical alerts
The situation with S3 alerts was more manageable: there are fewer of them, and they are less critical. Moreover, only some of our teams dealt with this category of alerts.
Thus, we devised the second stage of the recovery plan based on the audit results. It mainly involved checking the availability of less critical server applications such as ZooKeeper.
A pinch of Bash magic
To replace the external service health checks and alerts with our temporary solutions, we had to devise a mechanism for deploying up-to-date monitoring scripts to all servers (and, therefore, keeping them up-to-date). We used Ansible playbooks to deploy all the necessary scripts, including the one for auto-updates. The latter pulled new versions of all the required scripts every 10 minutes. Most scripts were written in Bash due to time constraints.
Here is the general approach we used:
- We wrote shell scripts to execute on virtual machines and bare-metal servers. These scripts not only made actual monitoring checks but also delivered alerts to the monitoring system. These alerts had the same labels and other properties (the trigger name, severity, and auxiliary labels) as the external service alerts. This allowed us to keep the monitoring logic we used before the incident. All these actions made it possible to leave the operations of engineers on duty as-is and keep the existing incident management rules. Fortunately, we already had tools for working with the monitoring API at our disposal (e.g., our in-house tool), so this stage was implemented quickly.
- We deployed new monitoring scripts to each target application/server using Ansible playbooks. We had to write Ansible playbooks from scratch. However, thanks to our internal system that stores a list of all maintained hosts, the deployment process went smoothly.
- For some time, we performed independent checks to make sure the alerts were accurate and the scripts ran correctly.
Summing it all up
It took us one working day to fully implement the temporary solution for S1 and S2 alerts and one more day for S3 alerts. The teams added handlers for other incidents (with a lower priority) individually whenever required.
In total, new scripts were deployed to approximately 3000 hosts.
We provided detailed reports about the recovery progress to our customers at each stage:
Later, we started posting the current status and the recovery progress both in text form and at regular weekly meetings. Our customers were very supportive and responded positively to our efforts.
We disabled our “custom” monitoring solution after the third-party service fully restored its functionality. Then we deleted all its traces on the servers.
Takeaways
For us, the OVH incident has become a revealing case. It allowed us to test the fundamental decision-making and response competencies we nurture in our company. This incident affected all our teams and almost every engineer and employee. The main takeaway here is that well-coordinated teamwork and a concise, structured action plan (disaster recovery plan, DRP) allow you to solve complex problems quickly. And it is especially valuable in those rare moments when your entire infrastructure seems to fail all at once and you are not ready for events of such a scale.
Let me provide a few practical conclusions as well:
- You must distribute your infrastructure geographically (in addition to spreading it across several data centers) to increase its fault tolerance. The OVH incident clearly shows that formally independent data centers can be in the same place in real life. As a result, they both caught fire.
- During such incidents, there can be miscommunication between companies as well as between engineers within a single company: lack of information about the scale of the incident, slow response time, etc. This time we were lucky to avoid these problems. Nevertheless, we have revised our escalation rules and made them a bit stricter to eliminate the possibility of such problems in the future.
- Note that it is essential to keep your customers informed even if you are deeply immersed in saving your infrastructure and troubleshooting tech problems. That is why we were constantly updating the status of the incident and informing our customers and partners about the recovery progress. Yes, it takes extra resources and time, but the results are well worth it.

Comments