

We had to find an easy-to-use, reliable block-type storage for our Kubernetes platform. Hence I decided to benchmark several Open Source solutions to see how they behave under various conditions. The focal point was the DRBD performance in different configurations and how they compared to Ceph.
However, the market for software-defined storage is constantly growing and evolving. Ambitious new projects are emerging, including the recently released Mayastor and my fellow collaborator’s pet project Vitastor. The results were pretty exciting and surprising.
Testing environment
Hardware
- Server: three AX61 servers.
- CPU: AMD Ryzen 9 3900 (24) @ 3.100GHz.
- RAM: Micron 32GB DDR4-3200 ECC UDIMM 2Rx8 CL22 (four modules per server).
- Disks: SAMSUNG MZQLB1T9HAJR-00007 1.92 TB (two per server).
- Network: 10G (Intel 82599ES); 1G (Intel I210).
Core software
- OS: Ubuntu 20.04.3 LTS (Focal Fossa);
- Kernel: 5.4.0-54-generic.
Main software versions
- DRBD: 9.1.4 (linstor-server v1.17.0);
- Ceph: 16.2.7 (rook v1.8.2);
- Mayastor: 1.0.0;
- Vitastor: 0.6.12 (kernel 5.13.0-27-generic);
- ZFS: 0.8.3;
- LVM: 2.03.07.
Miscellaneous
- Virtual volume size: 100G (in tests with a single client); 10G (in tests with multiple clients);
- DRBD synchronization protocol: C (fully synchronous), bitmap is enabled.
Benchmarks
The benchmarking was carried out in several steps:
- measuring the performance of “raw” NVMe drives;
- measuring the backend overhead (LVM vs LVMThin vs ZFS);
- measuring the DRBD overhead;
- comparing with other clustered file systems;
- benchmarking over a gigabit network;
- stress testing.
@vitalif helped me find suitable benchmarks that reflect reality, rather than just flashing “pretty” numbers. He is an active participant in the Сeph-related and various SDS communities. On top of that, he develops his own clustered file system called Vitastor. I believe that being such a knowledgeable person, he is well-versed in this subject. That are the tests he has been using for many years already:
fio -name=randwrite_fsync -ioengine=libaio -direct=1 -randrepeat=0 -rw=randwrite -bs=4k -numjobs=1 -iodepth=1 -fsync=1
fio -name=randwrite_jobs4 -ioengine=libaio -direct=1 -randrepeat=0 -rw=randwrite -bs=4k -numjobs=4 -iodepth=128 -group_reporting
fio -name=randwrite -ioengine=libaio -direct=1 -randrepeat=0 -rw=randwrite -bs=4k -numjobs=1 -iodepth=128
fio -name=write -ioengine=libaio -direct=1 -randrepeat=0 -rw=write -bs=4M -numjobs=1 -iodepth=16
fio -name=randread_fsync -ioengine=libaio -direct=1 -randrepeat=0 -rw=randread -bs=4k -numjobs=1 -iodepth=1 -fsync=1
fio -name=randread_jobs4 -ioengine=libaio -direct=1 -randrepeat=0 -rw=randread -bs=4k -numjobs=4 -iodepth=128 -group_reporting
fio -name=randread -ioengine=libaio -direct=1 -randrepeat=0 -rw=randread -bs=4k -numjobs=1 -iodepth=128
fio -name=read -ioengine=libaio -direct=1 -randrepeat=0 -rw=read -bs=4M -numjobs=1 -iodepth=16
Here is an excerpt from his article explaining this approach:
Why use this approach in benchmarking? After all, there are many parameters that factor in on disk performance, such as:
- Block size;
- Mode — read, write, or various mixed read/write modes;
- Parallelism — queue depth and the number of threads, in other words, the number of parallel I/O requests;
- Test duration;
- Initial disk state — empty, filled linearly, filled randomly, and randomly written over a specific period of time;
- Data distribution — for example, 10% of hot data and 90% of cold data or hot data located in a certain place (e.g., at the beginning of the disk);
- Other mixed test modes, e.g, benchmarking using different block sizes at the same time.
The results can also be presented with varying levels of detail — you can provide graphs, histograms, percentiles, and so on in addition to the mere average operation count or megabytes per second. This, of course, can reveal more information on the behavior of the disk being tested.
Benchmarking is also accompanied by a bit of philosophy. For example, some server SSD manufacturers argue that you must do preconditioning by randomly overwriting the disk at least twice to fill the translation tables before testing. I believe, on the contrary, that it puts the SSD in unrealistically bad conditions rarely encountered in real life.
Others say you should plot a graph of latency against the number of operations per second, but in my opinion that’s also a bit strange, as it implies that you plot a graph of F1(q) against F2(q) instead of “q” itself.
In short, benchmarking can be a never-ending process. It can take quite a few days to obtain a complete view. This is usually what resources like 3dnews do in their SSD reviews. But we don’t want to waste several days of our time. We need a test that allows us to estimate performance quickly.
Therefore we isolate a few “extreme” modes, check the disk in them, and pretend that other results are somewhere in the middle between these “extremes”, forming some kind of smooth function depending on the parameters. It’s also handy that each of these modes also corresponds to a valid use case:
- Applications that mainly use linear or large-block access: for such applications, the crucial characteristic is the linear I/O speed in megabytes per second. Therefore, the first test mode is linear read/write with 4 MB blocks and a medium queue depth of 16-32 operations. The test results should be in MB/s.
- Applications that use random small-block access and support parallelism. This leads us to 4 KB random I/O modes with a large queue depth of at least 128 operations. 4 KB is the standard block size for most filesystems and DBMS. Multiple (2-4-8) CPU threads should be used if a single thread can’t saturate the drive during the test. Test results should include iops (I/O operations per second), but not latency. Latency is meaningless in this test, because it can be arbitrarily increased just by increasing the queue depth — latency is directly related to iops with the formula latency=queue/iops.
- Applications that use random small-block access and DO NOT support parallelism. There are more such applications than you might think; regarding writes, all transactional DBMSs are a notable example. This leads us to 4 KB random I/O tests with a queue depth of 1 and, for writes, with an fsync after each operation to prevent the disk or storage system from “cheating” by writing the data into a volatile cache. The results should include either iops or latency, but not both because, as we’ve previously said, they directly relate to each other.
Based on this information, I wrote a script that runs each test, then collects and parses the obtained data. Note that all the graphs below are based on the eight tests listed above. Each test ran for precisely one minute. Sure, that amount of time is not enough to fully explore all the subtleties, but it is quite sufficient for a general comparison of different solutions.
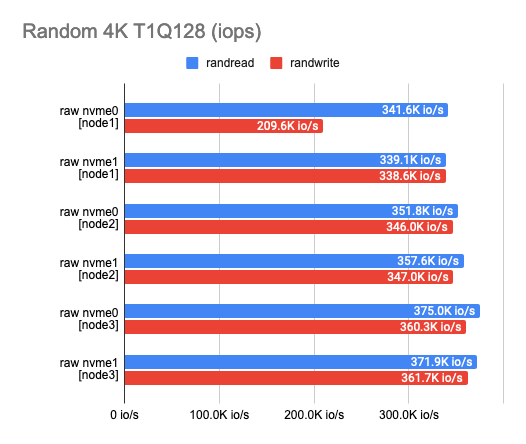
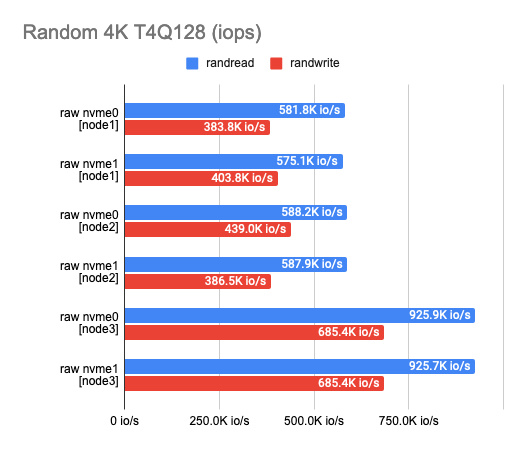
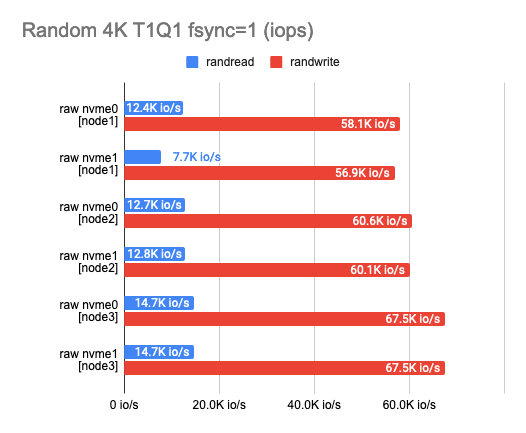
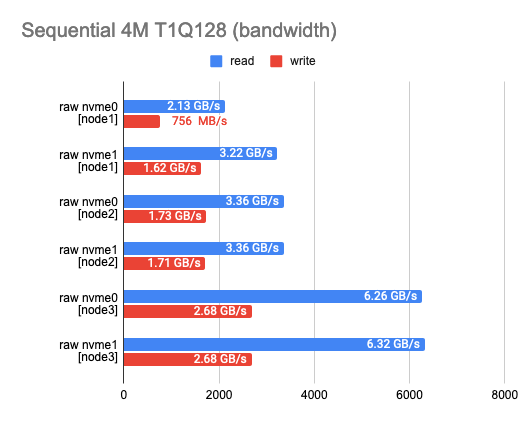
1. Measuring “raw” NVMe performance
Any benchmarking should start with a test of the drives themselves. It’s a starting point to see how much we’ve lost in performance. According to the test results, you can see that the disks I use somewhat vary in performance – this is (probably) due to their aging.
2. Measuring the backend overhead
Now that I have the raw NVMe performance, I need to measure the performance of each backend. As you probably know, DRBD can work on top of any block device and even on top of a raw unpartitioned disk. However, since the release of DRBD9, the idea of using a dedicated device for each virtual machine or container has become mainstream since it facilitates scaling and reduces the impact of system failures. The logical volume manager makes it much easier to prepare new volumes with the right size in batches. In addition, it enables various cool features like live resizing, snapshots, deduplication, etc.
LINSTOR supports different backends, including LVM, LVMThin, and ZFS. They will be tested below. For testing, I used the fastest disk available (on node 3) and measured their performance. Here’s what I got:
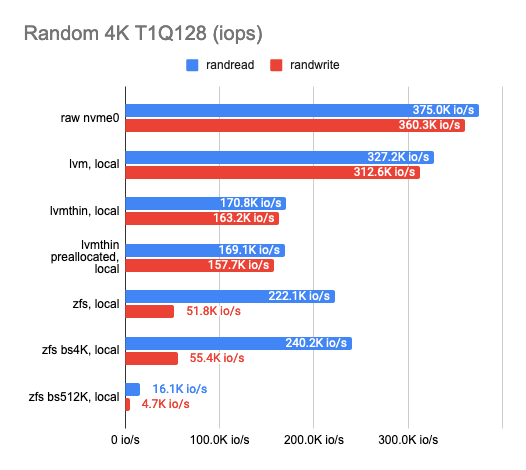
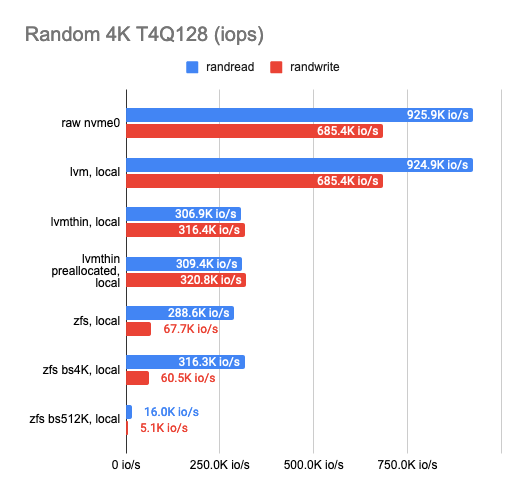
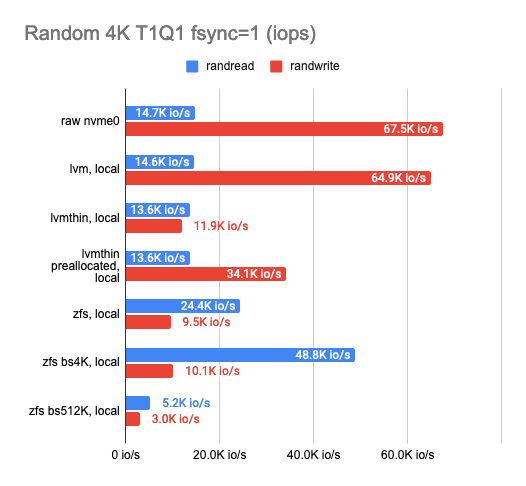
As you can see, the classic LVM shows almost no overhead compared to LVMThin and ZFS, but there aren’t many features it supports.
If we want to take snapshots, we have to use LVMThin or ZFS since they support COW and can take snapshots without any impact on performance.
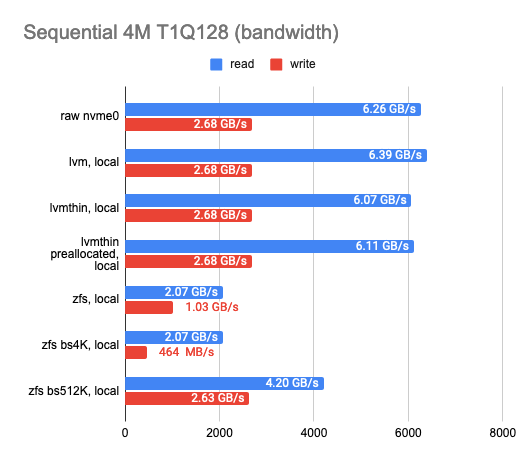
The sequential read/write operations of LVMThin are fine, but the random read/write operations leave much to be desired. Performance results get better if the entire volume is filled with zeros (thus, the disk space gets preallocated) and reaches half the performance of a “raw” disk.
ZFS results are noticeably worse. I tried to tweak it by adjusting the block size. Unfortunately, it had almost no effect on the results (I tested 512, 4K, 32K, and 512K block sizes; the default is 8K). The smaller block size slightly increased the performance, but the latency also rose significantly. The larger block size increased the sequential read and write speeds, but that was not the goal I was aiming for.
Then I decided to set ZFS aside and try the same trick with LVMThin. Alas, changing the block size had almost no effect on the test results.
Eventually, I settled on LVM or LVMThin with the default settings.
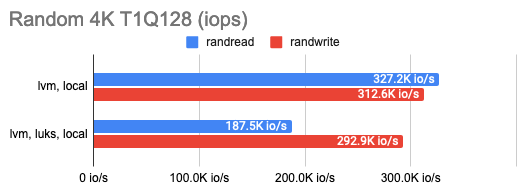
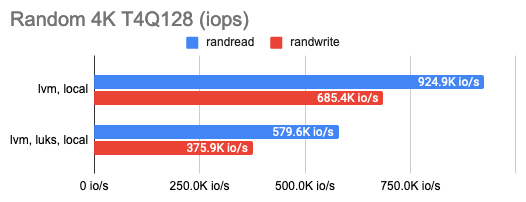
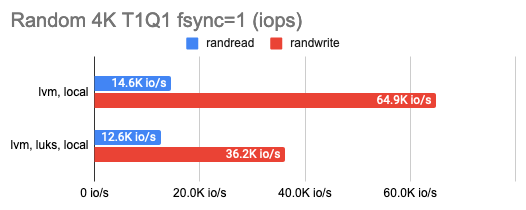
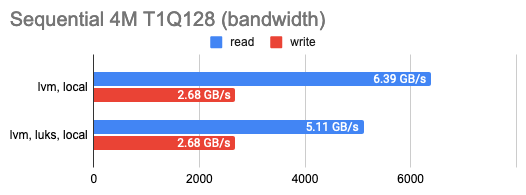
LINSTOR can encrypt volumes with LUKS, and I was curious how much this encryption would cost in terms of performance loss. It turned out that the impact on LUKS was marginal: performance barely changed for occasional random read/write or sequential operations and only halved for a series of random operations. You can see that in the graphs:
3. Measuring the DRBD overhead
After settling on the backend, I proceeded to determine the DRBD replication overhead. I tested each of the available backends, but I would only mention LVM as a prime example here. I used the following three configurations for DRBD benchmarking: 1 replica (pure DRBD overhead), two replicas locally, and two replicas with a remote diskless client. Here are the results:
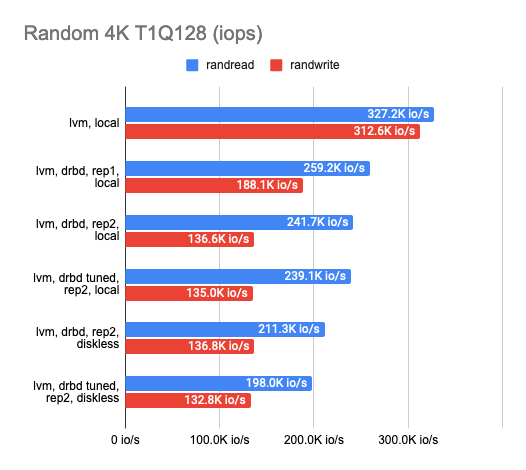
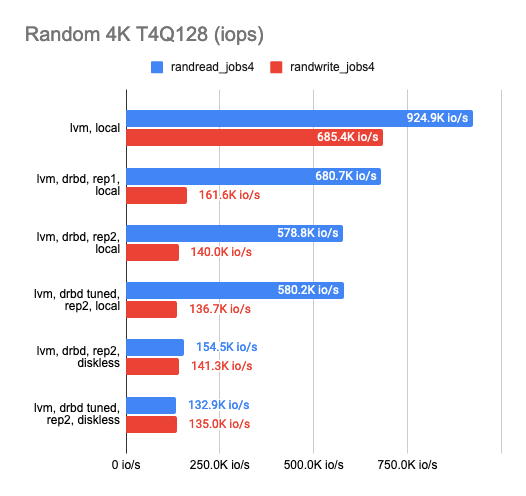
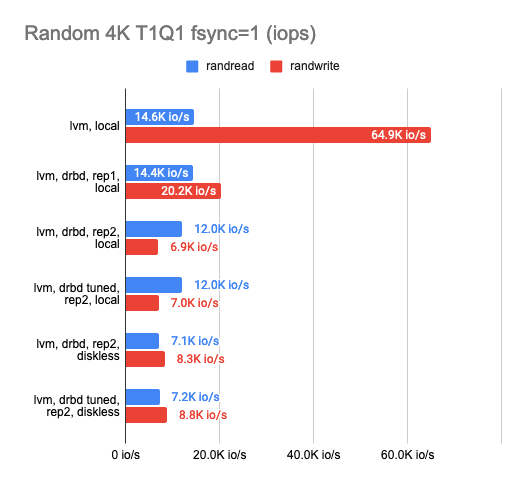
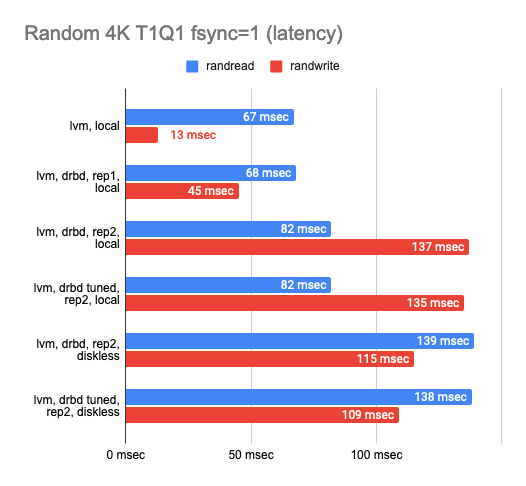
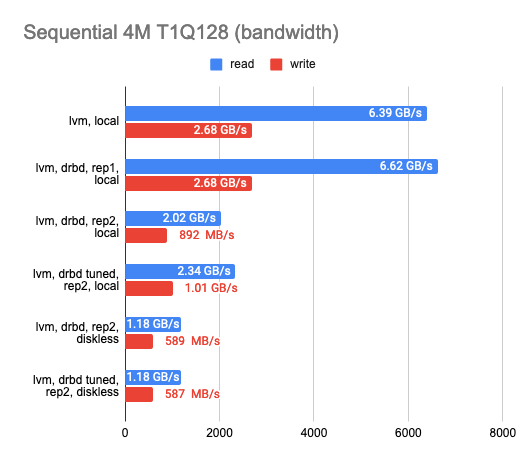
The graph shows that DRBD reduces the random read/write speed significantly, leaving sequential operations with almost no overhead.
Enabling the second replica reduces the operation speed slightly and increases latency in tests without parallelism. But that makes perfect sense: we write to both replicas simultaneously and wait for the operation to complete for each one of them.
In the case of the diskless client, both replicas are on a remote server, so the client needs to connect to both of them, hence the speed degradation and increased latency.
The following conclusions can be drawn at this point:
- In the case of two replicas where one of them is local, the performance dropped threefold while the latency doubled compared to the “raw” device (actually it’s just overhead for the CPU).
- In the case of two replicas and a remote diskless client, the performance dropped by a factor of four or more while the latency doubled.
DRBD tweaking had almost no effect on the final result, so I did without it in subsequent tests.
4. Comparison with other clustered file systems
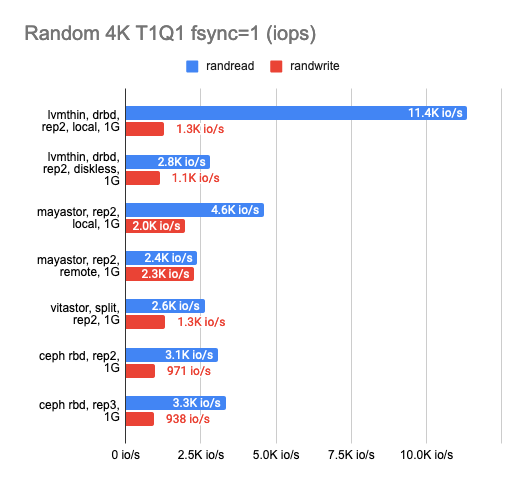
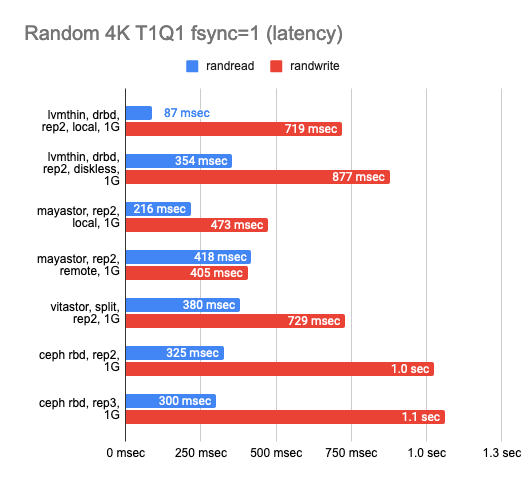
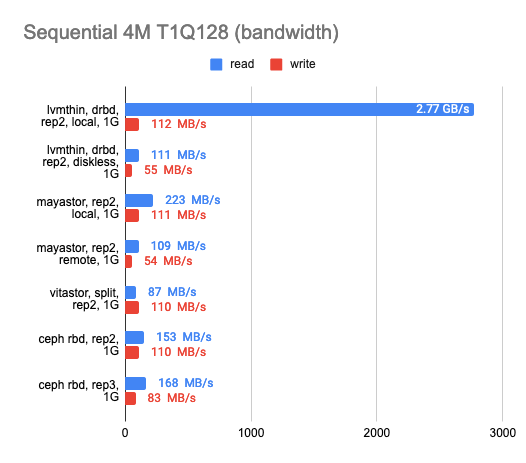
It looks like many abstraction layers result in far too much performance loss, so at this point, I decided to compare the DRBD stack with other solutions. There were three of them: Ceph RBD, Mayastor, and my friend’s experimental storage, Vitastor. To keep things fair, I decided to use the slower backend, LVMThin, which supports COW and snapshot creation just like many other cluster FSs other than Mayastor.
Here’s what I got:
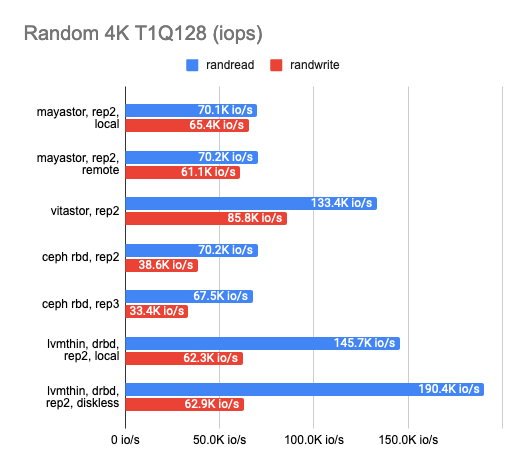
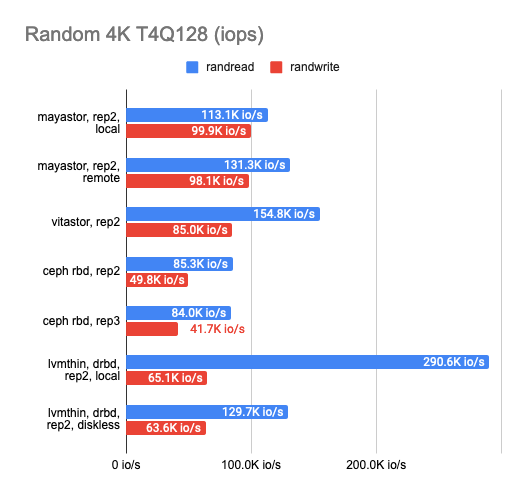
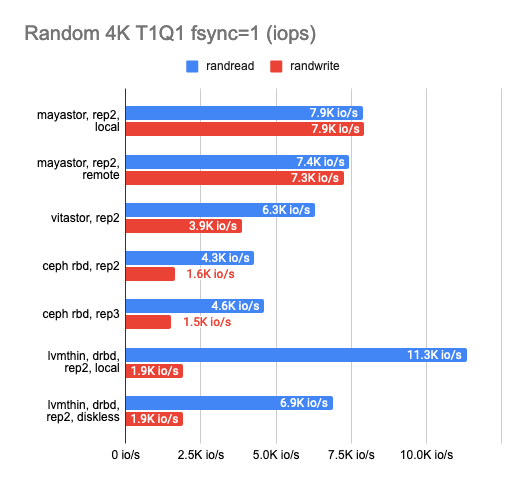
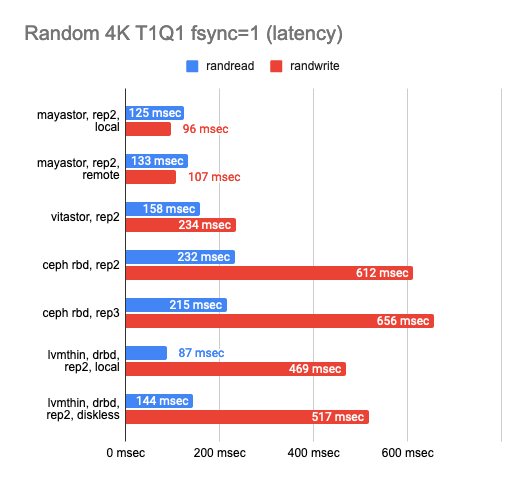
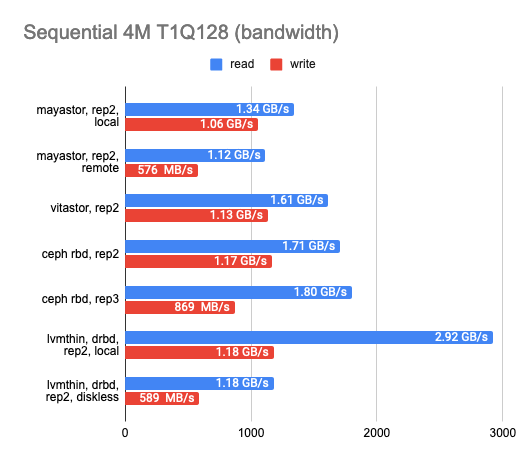
The results surprised me. Local Mayastor ranked first in random write operations, while Vitastor ranked second, followed by local DRBD, Ceph, and diskless DRBD. The local DRBD was the best in reading tests, with good results and the lowest latency.
5. Benchmarking over a gigabit network
I was also wondering how each of the solutions would perform on a gigabit network:
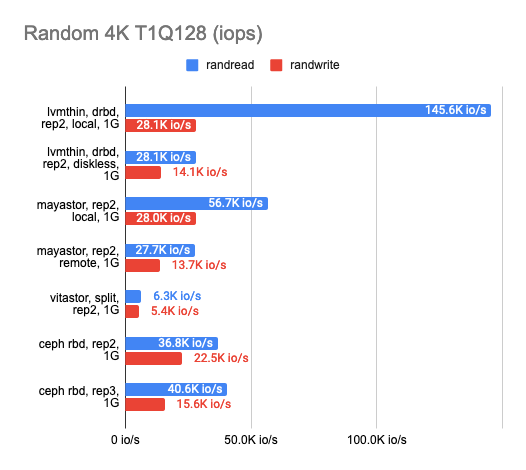
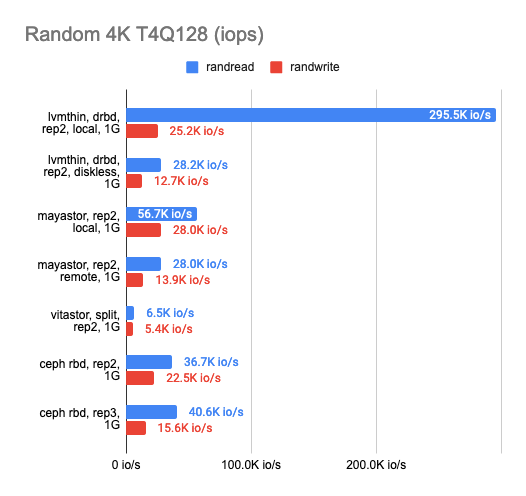
As you can see, all four solutions utilized the gigabit ethernet channel perfectly. However, the results left much to be desired. Mayastor performed a little better than the others. The local DRBD was brilliant in reading, but writing speed was equally bad for the whole gang.
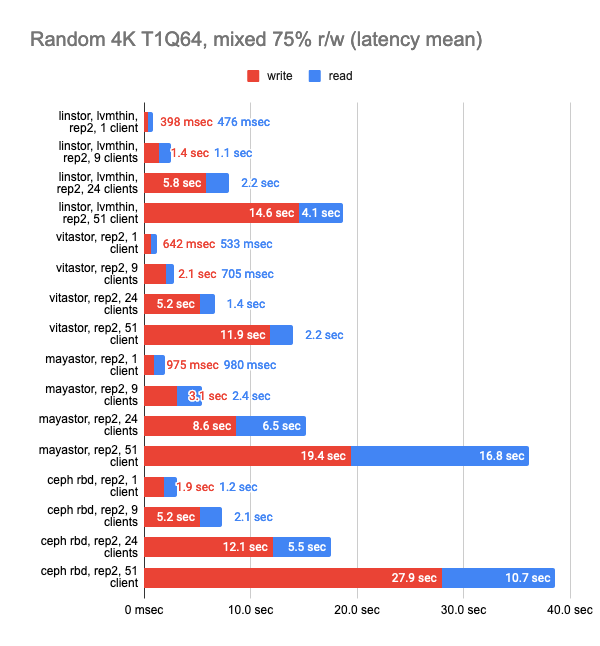
6. Stress testing
Now for the most exciting part: the stress testing. The tests above were aimed at understanding storage capabilities. For this part, I’ll try to simulate the real-world load and see how each solution can handle it.
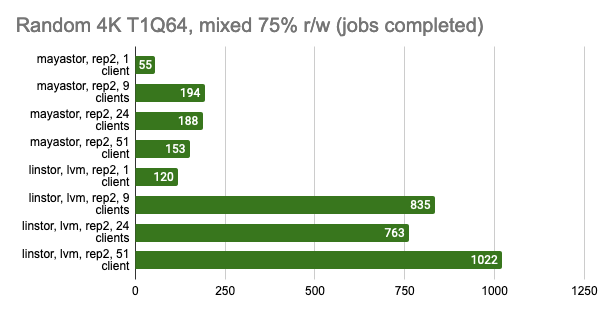
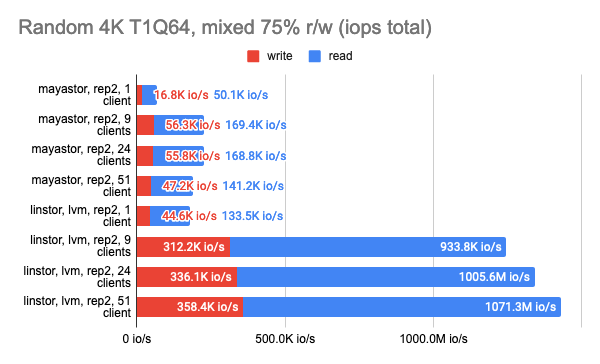
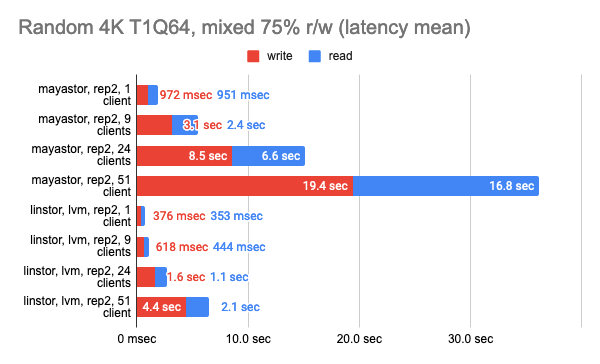
I’ll use a standard r/w test with 75% of random read and 25% of random write operations and run several copies of it.
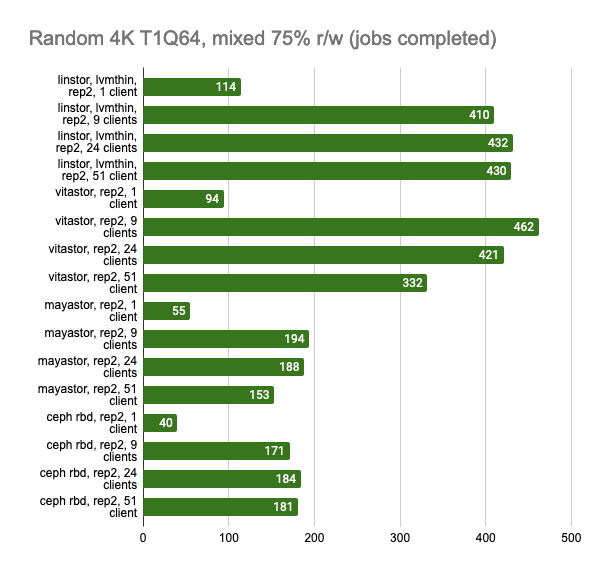
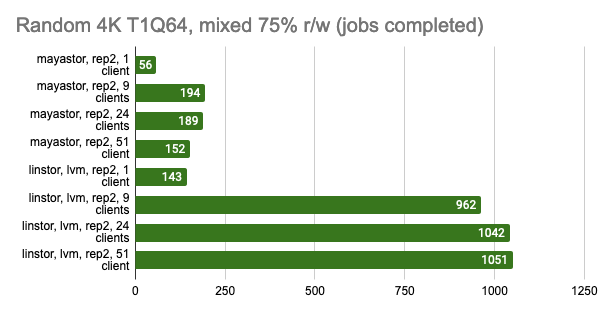
fio -name=test -filename=/dev/xvda -ioengine=libaio -direct=1 -rw=randrw -rwmixread=75 -bs=4k -numjobs=1 -iodepth=64 -size=4GI’ll set a time limit of 15 minutes and see how many tests get completed in that time, and then I’ll compile the generalized stats.
LINSTOR and Mayastor have a small head start over the other solutions because they suggest setting volumeBindingMode: WaitForFirstConsumer, thus provisioning volumes on the same node that our Pod will end up on. I decided to disable this feature to compare solutions in similar environments.
The Ceph was also configured to run two OSDs per drive and have more Placement Groups (512).
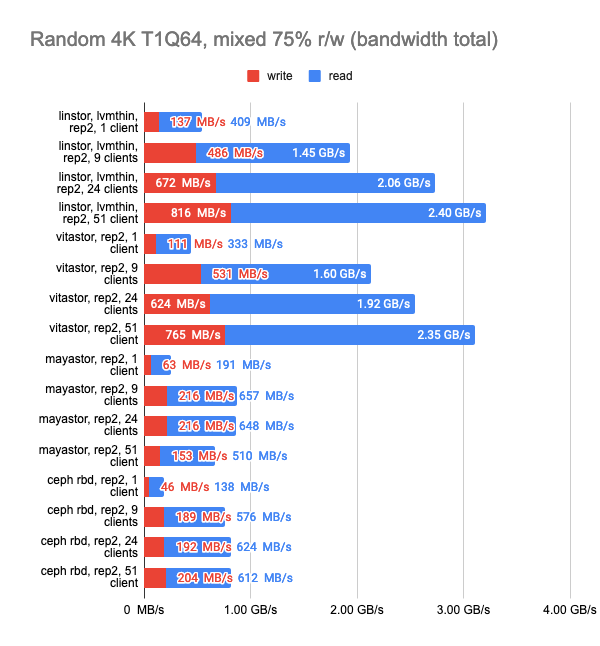
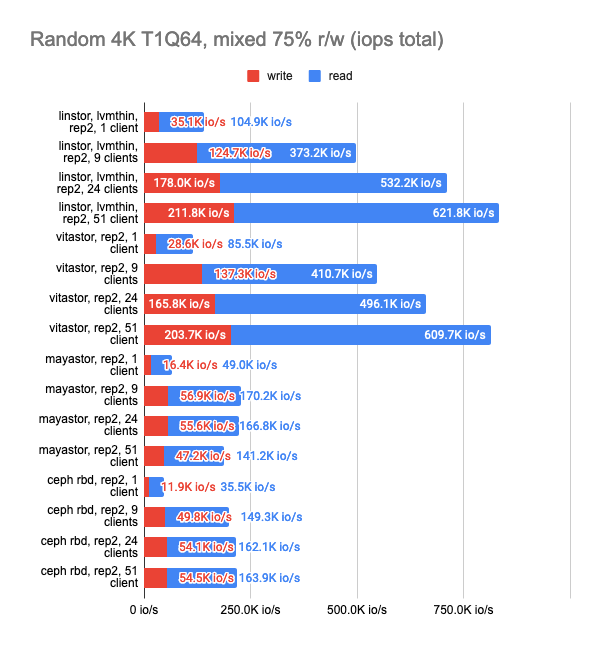
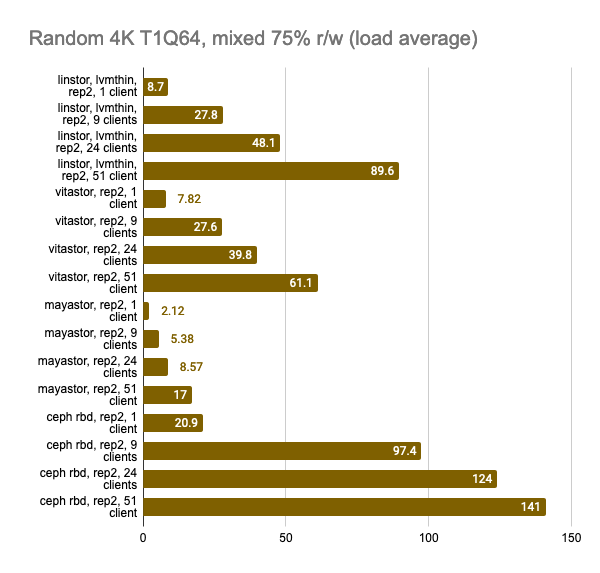
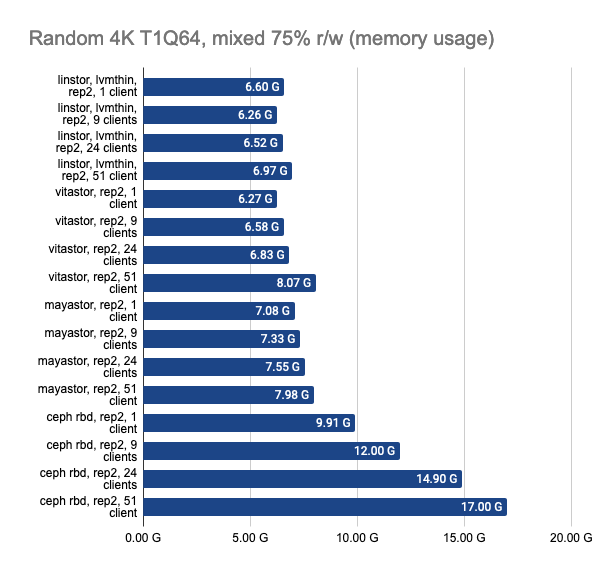
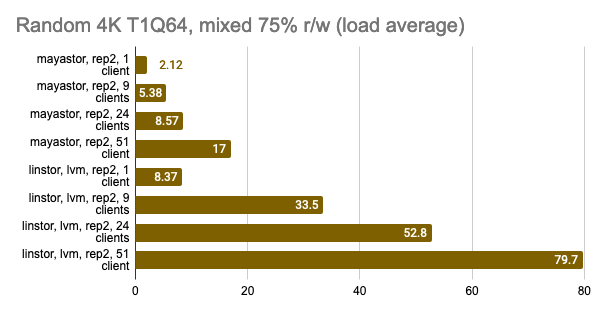
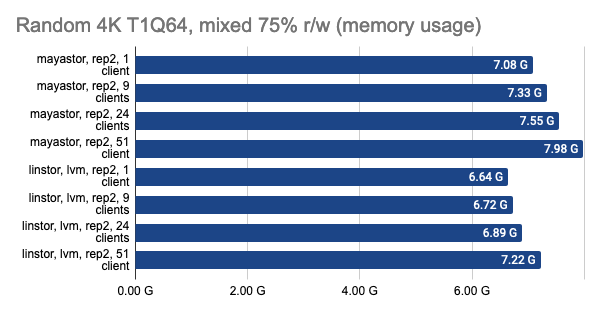
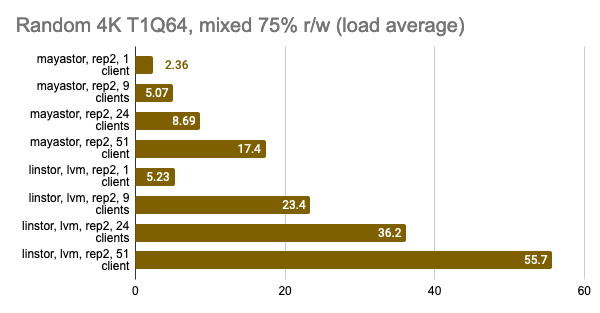
The last two graphs show the total resource consumption on the node, but this information is hardly objective, so do not take them for granted. For a more detailed analysis, I suggest looking at the Grafana snapshots.
Grafana snapshots:
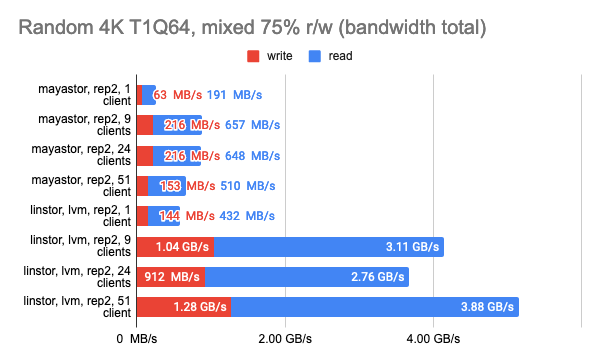
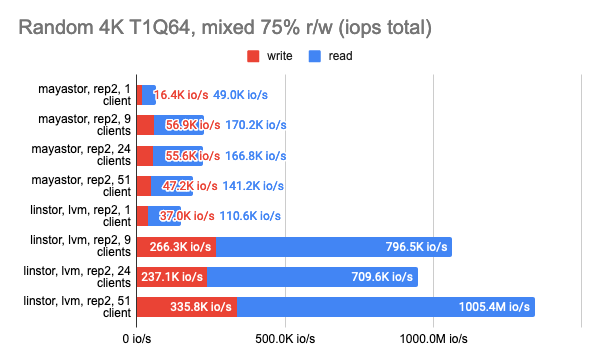
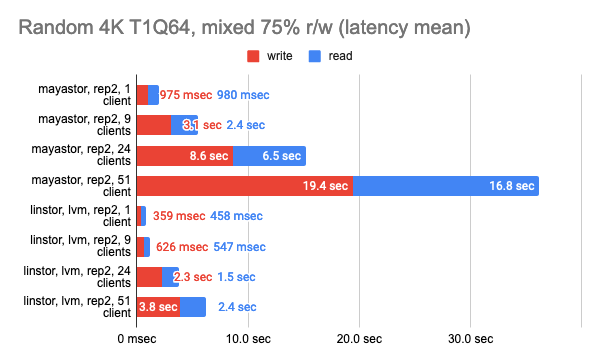
LINSTOR showed consistently good results even with a large number of clients; however, Vitastor was nearly just as good. Mayastor and Ceph subsequently followed far behind them. In addition, Ceph consumes significantly more RAM and CPU time, as the Grafana graphs clearly show.
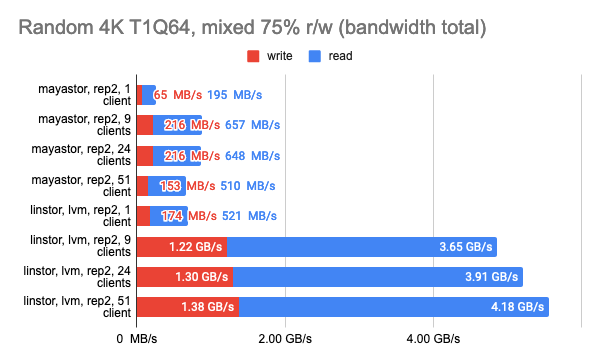
Here, I must point out that Mayastor currently does not support COW and snapshots, so you can confidently compare it to LINSTOR with an LVM backend:
Grafana snapshots:
The results of the LINSTOR test with 24 local clients were rather strange — the cluster was probably busy doing something else. But the general trend is clear: the LINSTOR + LVM configuration has significantly outperformed Mayastor. The good thing about Mayastor is that it has a lower CPU average load.
On the other hand, I can enable volumeBindingMode: WaitForFirstConsumer and see how much the test results change. Note that in this mode, at least one replica is local, i.e., it’s in the same place where the Pod is running:

Grafana snapshots:
Takeaways
Based on the benchmark results, I can say that in the configuration I used:
- LINSTOR performed as one of the fastest storage solutions.
- Vitastor was pretty close behind, which (if you consider its Ceph-like architecture) looks very promising. That would, for example, allow a load of individual block devices to be distributed among all cluster nodes.
- Mayastor did a pretty good job, but at the moment, it was lacking in features. LINSTOR in a similar configuration was faster if the number of clients was high.
- Ceph consumed too many node resources (they usually appear to be the bottleneck). Currently, its developers are working on a new Crimson backend – when it’s released, I expect things will get better in that respect.
For our case, LINSTOR was chosen as the most mature, production-ready solution.
A few words about fault tolerance
These benchmarks allow you to evaluate the performance of a particular solution. However, you should not forget about fault tolerance. Before drawing any conclusions, you have to ascertain that the selected solution is reliable and be sure to perform crash tests for it. However, that is beyond the scope of this article.
Personally, we’re quite certain about Ceph’s and LINSTOR’s fault tolerance. LINSTOR is more straightforward and does not require running an external database to store metadata; it can store its configuration directly in Kubernetes CRDs. In addition, over the years, I have accumulated a lot of experience integrating and using LINSTOR in production environments.
Nevertheless, you should not regard my experience as an unquestionable truth. Base your decisions on your own needs, experiments, and expertise!

What a huge work you have done, Dmitry. Testing all those options (Linstor, Ceph, Vitastor and the other) are not a simple task, and I imagine it took you many days, maybe weeks, to complete all the tests.
Thank you so much for it!
Thank you very much for your kind feedback, Paulo! Actually, it was not me but Andrei who performed all these tests and wrote the article, though 🙂 I’ll make sure he sees your comment!
Great work here!
Is code available for the graphs?.. or the JSON results to help create similar charts?
Hi! Thanks a lot for noticing that our original links to Grafana dashboards didn’t work anymore. All of them are updated now, so you get all the relevant data.
Still feel ceph, without k8s, is rock solid over heterogeneous as well as similar mixed storage and compute clusters. Would love to see optimal setup of each over same 9 nodes. 1osd per drive, not 2. Replication locally vs distributed without k8 overhead. Test k8 vs lvm native… see performance of different hypervisor setups… anyhow, thanks for the detailed write-up! Gives me some ideas to look into. Cheers!