

It’s 2020 already, and there is still no common solution for aggregating logs in Kubernetes. In this article, we would like to share our ideas, problems encountered, and solutions — all these with the help of real-life examples. Generally speaking, most of the things described here can be applied not just to Kubernetes but to any kind of modern infrastructure…
For a start, I’d like to note that there are radically different ideas of what logging is:
- someone would like to see security and audit logs only;
- someone else prefers the centralized logging of the entire infrastructure;
- while the other one wants to see the application logs excluding, for example, load balancers.
Here is how we have implemented different functionality and overcome various constraints. However, let’s start with a brief theory.
A bit of theory: Logging tools
Origins of the components of the logging system
Logging as a discipline boasts an eventful and rich history. In the end, we have got the methodology for collecting and analyzing logs that is actively used today. Back in the 1950s, the analog of standard input/output streams was introduced in Fortran, which helped programmers debug their programs. These were the first attempts at logging, and these tools made life easier for programmers of those days. Today we consider them one of the earliest components of the logging system — the source, or “producer” of logs.
Meanwhile, computer science continued to evolve: computer networks and first clusters have emerged… The first complex systems consisting of several machines have been introduced. Now, system administrators were forced to collect logs from multiple machines, and in some particular cases, they could even accumulate OS kernel messages to investigate a system failure. In the early 2000s, RFC 3164 was introduced. It standardized remote_syslog and provided the basis for defining centralized logging systems. That is how another essential component — the collector of logs and a mechanism to store them — has emerged.
The growing volume of logs and the widespread adoption of web technologies have led to the question of how to present logs to the user in the most accessible form. Simple console tools (awk/sed/grep) were replaced by more advanced log viewers. It was the third component of the modern logging system.
The increasing amount of logs made it clear: we need logs, but not all of them. Moreover, it turned out that different types of logs have varying levels of importance: some can be deleted the next day, while others need to be stored for five years or more. Thus, the logging system has acquired the data filtering and routing component; we will call it a filter.
The storage has also seen numerous improvements: regular files were replaced by relational databases and later by document-oriented storages (e.g., Elasticsearch). As a result, the storage has been separated from log collecting.
In the end, the concept of the log itself has been broadened to some abstract stream of events that we would like to save for history, or rather, keep it in case we need to conduct an investigation or make some analytical report.
Eventually, in a relatively short time, logging turned into a rather important subsystem that might be rightfully classified as Big Data.
Kubernetes and logging
When Kubernetes became a part of modern infrastructure, the problem of the collection of logs manifested itself with renewed vigor: the management of the infrastructure platform was both streamlined and made harder at the same time. Many established services started migrating to microservices approach. Regarding logging, this resulted in a growing number of log sources, their unique life cycle, and the need to track interactions of all system components via logs.
Looking ahead, I would like to note that currently, there is no standardized logging option for Kubernetes that stands above the rest of the pack. Here are the most popular schemes sought by the community:
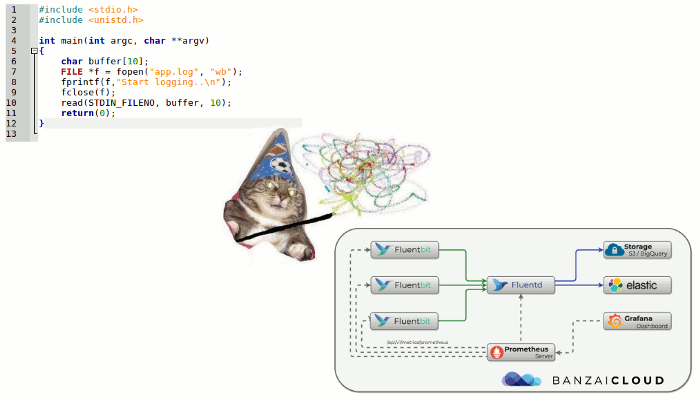
- deploying an EFK stack (Elasticsearch, Fluentd, Kibana);
- using the recently released Loki or the Logging operator.
Personally, we tend to use the following bundles in K8s clusters for self-hosted solutions:
I am not going to tell you how to install and configure them. Instead, I will focus on their shortcomings and the situation with logs in general.
Logging routines in K8s

Day-to-day logging explained…
Centralized logging of a large infrastructure requires considerable resources that will be spent on collecting, storing, and processing data. While operating a diverse range of applications & platforms, we have to satisfy various requirements and deal with operating problems arising from them.
Case study: ClickHouse
Let’s consider centralized storage in the case of an application that generates a lot of logs: say, over 5000 lines per second. We will be using ClickHouse to process them.
While attempting to ensure real-time collection, we would run into a problem: it turns out that the 4-core server running ClickHouse cannot handle such a load, and its disk subsystem is severely overloaded:
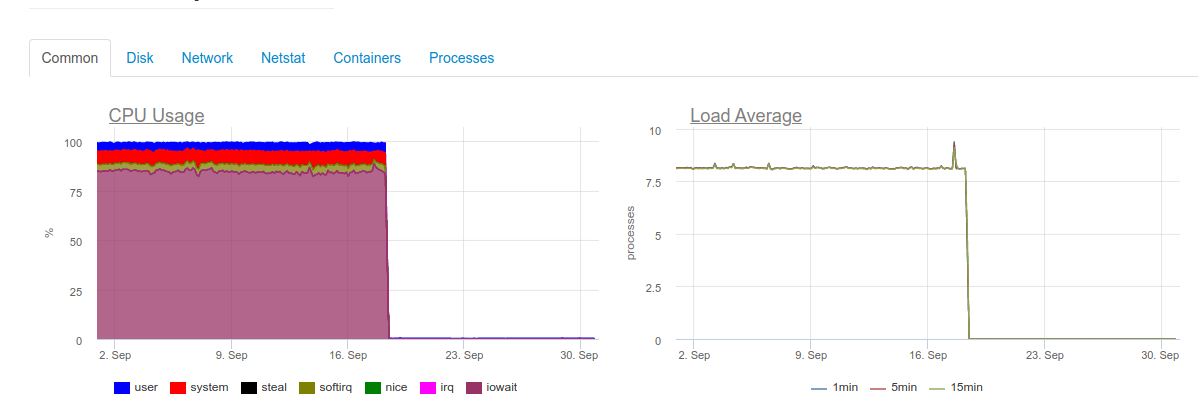
DB::Exception: Too many parts (300). Merges are processing significantly slower than insertsThe fact is that MergeTree tables in Click House (where logs are stored) have their own complications when writing is performed. The inserted data generates a temporary partition that is later merged with the main table. As a result, writing tasks tend to be very disk-demanding. Hence the error represented above: no more than 300 sub-partitions can be merged per second — that’s 300 inserts per second.
To avoid such complexities, we should use as large chunks as possible when writing into ClickHouse while at the same time decreasing the frequency of writes to one time per two seconds, at least. However, writing in large batches brings another risk: the risk of buffer overflow and loss of logs. The obvious solution is to increase the Fluentd buffer. However, in this case, memory consumption will increase.
Thus, it becomes clear that the ClickHouse-based real-time logging solution can be resource demanding and won’t be a reasonable option for many applications. Also, you will need an accumulator (more about it later). The case we describe here is based on our real-life experience. At that time, we could not find a reliable and stable solution for collecting logs with a minimum delay that would have suited the customer.
What about Elasticsearch?
Elasticsearch is known to handle high loads. Let’s try it for the same application. Now, the load looks like this:
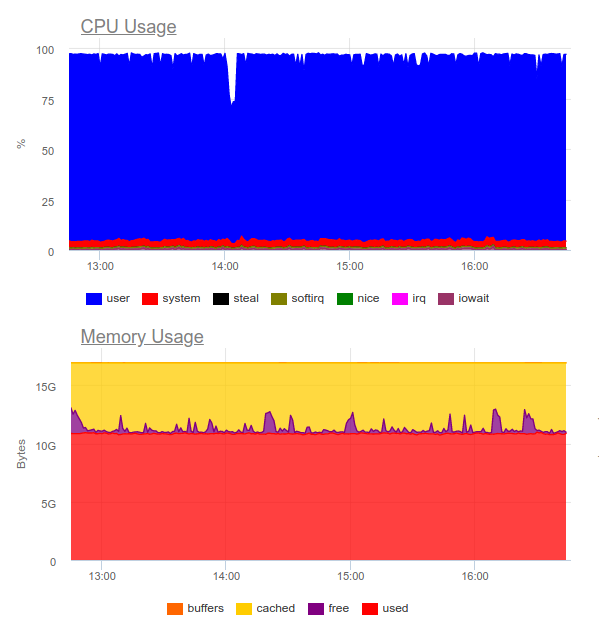
Elasticsearch has successfully digested the data flow. However, the process has been very CPU-demanding. It is not a problem from a technical standpoint — you can solve it by reorganizing the cluster. But we end up using a whopping 8 cores for a mere log collection and getting an additional highly loaded component in the system.
To sum it up, such an approach is quite viable in the case of a large project and if the customer is ready to spend significant resources on a centralized logging system.
Then it’s fair to ask:
What logs do we really need?

What if we reframe the task itself? Say, logs must be informative and cover only the required events.
Suppose we have a thriving and successful online store. What logs do we need? We need as much information as possible from a payment gateway, obviously. Wherein, the service for showing images in the product catalog is not so critical: we can limit logging to errors and overall monitoring (for example, the percentage of 500’s errors that this component generates).
The main takeaway is that centralized logging does not always make sense. Often, the customer wants to accumulate all logs in a single place, although, say, only 5% of the messages have any relevance (only those that are critically important for business):
- Sometimes it is as simple as, say, configuring the log size and an error collector (e.g., Sentry).
- Often, error alerts and a comprehensive local log are enough to investigate incidents.
- We have had projects that used functional tests and error collection systems only. Developers did not need logs at all — they used error traces to figure out what’s happening.
Real-world example
Here is another great example. One day, we received a request from the security team of one of our customers. This client had some commercial solution that had been developed long before implementing Kubernetes.
They wanted us to integrate a centralized log collection system with security information and an event management tool, QRadar. This tool receives logs using the syslog protocol and collects them from the FTP server. However, our attempt at integrating it with the remote_syslog plugin for fluentd did not work out (as it turned out, we were not unique in this). Problems with configuring QRadar were on the side of the customer’s security team.
As a result, part of the logs critical to the business was uploaded to QRadar FTP, while the other part was redirected directly from the nodes via remote syslog. To do this, we have even created a basic chart (it could be useful for someone else). Thanks to the implemented flow, the customer has been able to receive and analyze critical logs (using its favorite tools), and we have been able to reduce costs related to the logging system by keeping data for the last month only.
Here is another example of what you shouldn’t do. One of our clients implemented a multi-line unstructured output of data to the log for every user-related event. As you can easily guess, it was challenging to store and analyze these logs.
Requirements for logs
The above examples lead us to the conclusion that besides choosing the log collecting system, we also have to define the standard for logs themselves! What are the requirements?
- Logs must be in a machine-readable format (e.g., JSON).
- Logs must be compact and support the ability to adjust the level of logging to debug potential problems. Accordingly, in production environments, a logging level such as Warning or Error must be set by default.
- Logs must be normalized, meaning that all lines in the log object must have the same field type.
The unstructured logs might lead to problems with loading logs into the storage and a halt in their processing. To illustrate, here is an example with a 400 error (which, I believe, many of our readers have encountered in the fluentd logs):
2019-10-29 13:10:43 +0000 [warn]: dump an error event: error_class=Fluent::Plugin::ElasticsearchErrorHandler::ElasticsearchError error="400 - Rejected by Elasticsearch"The above error means that you are sending a field with an unstable type to an index with defined mapping. A prime example of that is a field in the nginx log containing the $upstream_status variable. This variable can contain either a number or a string. For example:
{ "ip": "1.2.3.4", "http_user": "-", "request_id": "17ee8a579e833b5ab9843a0aca10b941", "time": "29/Oct/2019:16:18:57 +0300", "method": "GET", "uri": "/staffs/265.png", "protocol": "HTTP/1.1", "status": "200", "body_size": "906", "referrer": "https://example.com/staff", "user_agent": "Mozilla/5.0 (Windows NT 10.0; Win64; x64) AppleWebKit/537.36 (KHTML, like Gecko) Chrome/78.0.3904.70 Safari/537.36", "request_time": "0.001", "cache_status": "-", "upstream_response_time": "0.001, 0.007", "upstream_addr": "127.0.0.1:9000", "upstream_status": "200", "upstream_response_length": "906", "location": "staff"}
{ "ip": "1.2.3.4", "http_user": "-", "request_id": "47fe42807f2a7d8d5467511d7d553a1b", "time": "29/Oct/2019:16:18:57 +0300", "method": "GET", "uri": "/staff", "protocol": "HTTP/1.1", "status": "200", "body_size": "2984", "referrer": "-", "user_agent": "Mozilla/5.0 (Windows NT 10.0; Win64; x64) AppleWebKit/537.36 (KHTML, like Gecko) Chrome/78.0.3904.70 Safari/537.36", "request_time": "0.010", "cache_status": "-", "upstream_response_time": "0.001, 0.007", "upstream_addr": "10.100.0.10:9000, 10.100.0.11:9000", "upstream_status": "404, 200", "upstream_response_length": "0, 2984", "location": "staff"}
Logs show that the 10.100.0.10 server responded with a 404 error, and the request was redirected to another content storage. As a result, we have got the following value in the logs:
"upstream_response_time": "0.001, 0.007"This problem is so widespread that it was even awarded a special mention in the documentation.
What about reliability?
There are cases when all logs are equally vital. Typical approaches for collecting logs in K8s discussed above have some problems with this.
For example, fluentd cannot collect logs from short-lived containers. In one of our projects, the container with a database migration has run for less than 4 seconds, and then it has been deleted according to the respective annotation:
"helm.sh/hook-delete-policy": hook-succeededBecause of this, the log for running a migration has never made it into the storage (the before-hook-creation policy might help in this case).
Another example is Docker’s log rotation. Suppose there is an application that is writing to the logs intensely. In normal conditions, we can process all the logs. However, when some problem arises — like the problem with the wrong format described above — processing halts, and Docker rotates the file. As a result, business-critical logs can be lost.
That’s why it is important to split streams of logs so that the most valuable logs would go directly to the application, ensuring their preservation. You can also create some kind of a log accumulator — it would preserve critical messages if the storage is briefly unavailable.
Finally, we should not forget that every subsystem needs thorough monitoring. Otherwise, it is easy to encounter a situation when fluentd ends up in the CrashLoopBackOff state and stops sending logs, which can lead to the loss of valuable information.
Takeaways
As you can see, we leave aside SaaS solutions such as Datadog. Many of the problems we have touched upon have already been solved by commercial companies that specialize in log collecting. However, SaaS solutions are not suitable for all for various reasons (such as high costs or legal considerations in some countries).
At first glance, the centralized collection of logs looks like an easy task, but it isn’t. Here are a few considerations to remember:
- The detailed logging is justified for critical components only. For other systems, you can set up monitoring along with error collection.
- In production, it makes sense to minimize logging to avoid an excessive burden on the system.
- Logs must have a machine-readable, normalized, and strict format.
- A separate and autonomous stream should be used for critically important logs.
- The idea of a log accumulator looks promising. It can help you in case of load spikes and would make the load on the storage more uniform.
These simple rules, if applied wherever appropriate, allow the approaches described above to work smoothly, even if they lack some critical elements, such as a log accumulator.
Those who feel that these principles are excessive might find themselves in a situation where another highly loaded and inefficient component emerges in the system: logging.

Comments