

The modern web infrastructure consists of many diverse components with apparent and subtle connections. It is especially evident when running applications based on different software stacks, which is a common thing after the SOA/microservices approach has become widespread. Everything is even more complicated due to external factors such as third-party APIs, services, etc.
While all these applications are united by common architectural ideas and solutions, often you as an SRE engineer end up on unfamiliar territory in an attempt to figure out what’s going on. In such circumstances, the emergence of new errors is only a matter of time. This article describes some of the cases we have recently encountered. The list includes Golang, Sentry, RabbitMQ, nginx, PostgreSQL, and other well-known tools.
Case #1. Golang and HTTP/2
Running a benchmark that sends multiple HTTP requests to the web application has led to unexpected results. During the benchmark, a basic Go application calls another Go application that is behind Ingress/OpenResty. With HTTP/2 enabled, portion of requests fail with a 400 error code. To find the reasons behind such behavior, we have removed the remote Go application and defined a simple location in Ingress which always serves 200 standard response. However, the behavior has remained the same!
Then we decided to replicate the scenario on a non-Kubernetes machine. We generated a Makefile that creates two containers. One of those has benchmarks for NGINX, the other has benchmarks for Apache. Each container gets HTTP/2 responses with a self-signed certificate.
Let’s run our benchmarks with the concurrency=200:
1.1. Nginx:
Completed 0 requests
Completed 1000 requests
Completed 2000 requests
Completed 3000 requests
Completed 4000 requests
Completed 5000 requests
Completed 6000 requests
Completed 7000 requests
Completed 8000 requests
Completed 9000 requests

----- Bench results begin -----
Requests per second: 10336.09
Failed requests: 1623
----- Bench results end -----
1.2. Apache:
…
----- Bench results begin -----
Requests per second: 11427.60
Failed requests: 0
----- Bench results end -----
Probably, it all comes down to a less strict implementation of HTTP/2 in Apache.
Let’s set concurrency=1000:
2.1. Nginx:
…
----- Bench results begin -----
Requests per second: 11274.92
Failed requests: 4205
----- Bench results end -----
2.2. Apache:
…
----- Bench results begin -----
Requests per second: 11211.48
Failed requests: 5
----- Bench results end -----
It is worth noting that the results are not repeatable: with some runs, there are no issues at all.
We searched for related issues in the Golang’s GitHub and found #25009 and #32441. While examining them, we discovered the PR 903 that recommends disabling HTTP/2 in Go by default!
You have to deep dive into the architecture of the web servers to figure out what is happening here. In this particular case, disabling the HTTP/2 protocol for the specified service was enough to solve the issue.
Case #2. Old Symfony and Sentry
One of applications still runs a relic version of the Symfony PHP framework — v2.3. It is bundled with an old Raven client and a custom PHP class, which somewhat complicates debugging.
After we have migrated one of our services to Kubernetes, Sentry (which we use to monitor applications for the presence of errors) has suddenly stopped delivering events. In an attempt to replicate such behaviour, we have borrowed examples from the Sentry website. We have used two provided scenarios and copied DSNs from the Sentry’s settings. At first glance, everything was fine: error messages (seemingly) were sent one after another.
Here is a testing script, written in JavaScript:
<!DOCTYPE html>
<html>
<body>
<script src="https://browser.sentry-cdn.com/5.6.3/bundle.min.js" integrity="sha384-/Cqa/8kaWn7emdqIBLk3AkFMAHBk0LObErtMhO+hr52CntkaurEnihPmqYj3uJho" crossorigin="anonymous">
</script>
<h2>JavaScript in Body</h2>
  <p id="demo">A Paragraph.</p>
  <button type="button" onclick="myFunction()">Try it</button>
<script>
    Sentry.init({ dsn: 'http://33dddd76e9f0c4ddcdb51@sentry.kube-dev.test//12' });
    try {
      throw new Error('Caught');
    } catch (err) {
      Sentry.captureException(err);
    }
</script>
</body>
</html>
Here is another testing script, written in Python:
from sentry_sdk import init, capture_message

init('http://33dddd76e9f0c4ddcdb51@sentry.kube-dev.test//12')
capture_message('Hello World')  # Will create an event.
raise ValueError()
Yet events were lost somehow in the process. Everything looked like the event was sent since clients immediately generated a hash for the issue…
In the end, we have solved the problem easily. The events were sent via HTTP, however, Sentry service supported HTTPS only. A redirect from HTTP to HTTPS was provided, but the legacy client (old code on the Symfony side) was not able to follow the redirects — kinda unexpected behavior nowadays, isn’t it?
Case #3. RabbitMQ and third-party proxy
The Evotor cloud is used to connect cash registers in another application. Basically, it works like a proxy: POST requests from Evotor go directly into the RabbitMQ via the STOMP plugin implemented over WebSocket connections.
One of our developers had sent probes via Postman and had received the expected 200 OK responses, yet probes which had been sent through the cloud failed with a “405 Method Not Allowed” error.
- 200 OK:
source: kubernetes
namespace: kube-nginx-ingress
host: kube-node-2
pod_name: nginx-2bpt7
container_name: nginx
stream: stdout
app: nginx
controller-revision-hash: 5bdbfd564
pod-template-generation: 25
time: 2019-09-10T09:42:50+00:00
request_id: 1271dba228f0943ab2df0196ff0d7f67
user: client
address: 100.200.300.400
protocol: HTTP/1.1
scheme: http
method: POST
host: rmq-review.kube-dev.client.domain
path: /api/queues/vhost/queue.gen.eeeeffff111:1.online:55556666/get
request_query:
referrer:
user_agent: Mozilla/5.0 (X11; Linux x86_64) AppleWebKit/537.36 (KHTML, like Gecko) Chrome/65.0.3325.181 Safari/537.36
content_kind: cacheable
namespace: review
ingress: stomp-ws
service: rabbitmq
service_port: stats
vhost: rmq-review.kube-dev.client.domain
location: / nginx_upstream_addr: 10.127.1.1:15672
nginx_upstream_bytes_received: 2538
nginx_upstream_response_time: 0.008
nginx_upstream_status: 200
bytes_received: 757
bytes_sent: 1254
request_time: 0
status: 200
upstream_response_time: 0
upstream_retries: 0- 405 Method Not Allowed:
source: kubernetes
namespace: kube-nginx-ingress
host: kube-node-1
pod_name: nginx-4xx6h
container_name: nginx
stream: stdout
app: nginx
controller-revision-hash: 5bdbfd564
pod-template-generation: 25
time: 2019-09-10T09:46:26+00:00
request_id: b8dd789604864c95b4af499ed6805630
user: client
address: 200.100.300.400
protocol: HTTP/1.1
scheme: http
method: POST
host: rmq-review.kube-dev.client.domain
path: /api/queues/vhost/queue.gen.ef7fb93387ca9b544fc1ecd581cad4a9:1.online:55556666/get
request_query:
referrer:
user_agent: ru.evotor.proxy/37
content_kind: cache-headers-not-present
namespace: review
ingress: stomp-ws
service: rabbitmq
service_port: stats
vhost: rmq-review.kube-dev.client.domain
location: /
nginx_upstream_addr: 10.127.1.1:15672
nginx_upstream_bytes_received: 134
nginx_upstream_response_time: 0.004
nginx_upstream_status: 405
bytes_received: 878
bytes_sent: 137
request_time: 0
status: 405
upstream_response_time: 0
upstream_retries: 0- Tcpdump of the request sent through Evotor:
200.100.300.400.21519 > 100.200.400.300: Flags [P.], cksum 0x8e29 (correct), seq 1:879, ack 1, win 221, options [nop,nop,TS val 2313007107 ecr 79097074], length 878: HTTP, length: 878
    POST /api/queues//vhost/queue.gen.ef7fb93387ca9b544fc1ecd581cad4a9:1.online:55556666/get HTTP/1.1
    device-model: ST-5
    device-os: android
    Accept-Encoding: gzip
    content-type: application/json; charset=utf-8
    connection: close
    accept: application/json
    x-original-forwarded-for: 10.11.12.13
    originhost: rmq-review.kube-dev.client.domain
    x-original-uri: /api/v2/apps/e114-aaef-bbbb-beee-abadada44ae/requests
    x-scheme: https
    accept-encoding: gzip
    user-agent: ru.evotor.proxy/37
    Authorization: Basic
    X-Evotor-Store-Uuid: 20180417-73DC-40C9-80B7-00E990B77D2D
    X-Evotor-Device-Uuid: 20190909-A47B-40EA-806A-F7BC33833270
    X-Evotor-User-Id: 01-000000000147888
    Content-Length: 58
    Host: rmq-review.kube-dev.client.domain

    {'count':1,'encoding':'auto','ackmode':'ack_requeue_true'}[!http]
12:53:30.095385 IP (tos 0x0, ttl 64, id 5512, offset 0, flags [DF], proto TCP (6), length 52)
   100.200.400.300:80 > 200.100.300.400.21519: Flags [.], cksum 0xfa81 (incorrect -> 0x3c87), seq 1, ack 879, win 60, options [nop,nop,TS val 79097122 ecr 2313007107], length 0
12:53:30.096876 IP (tos 0x0, ttl 64, id 5513, offset 0, flags [DF], proto TCP (6), length 189)
   100.200.400.300:80 > 200.100.300.400.21519: Flags [P.], cksum 0xfb0a (incorrect -> 0x03b9), seq 1:138, ack 879, win 60, options [nop,nop,TS val 79097123 ecr 2313007107], length 137: HTTP, length: 137
    HTTP/1.1 405 Method Not Allowed
    Date: Tue, 10 Sep 2019 10:53:30 GMT
    Content-Length: 0
    Connection: close
allow: HEAD, GET, OPTIONS- Tcpdump of the curl request:
777.10.74.11.61211 > 100.200.400.300:80: Flags [P.], cksum 0x32a8 (correct), seq 1:397, ack 1, win 2052, options [nop,nop,TS val 734012594 ecr 4012360530], length 396: HTTP, length: 396
    POST /api/queues/%2Fvhost/queue.gen.ef7fb93387ca9b544fc1ecd581cad4a9:1.online:55556666/get HTTP/1.1
    Host: rmq-review.kube-dev.client.domain
    User-Agent: curl/7.54.0
    Authorization: Basic =
    Content-Type: application/json
    Accept: application/json
    Content-Length: 58

    {'count':1,'ackmode':'ack_requeue_true','encoding':'auto'}[!http]
12:40:11.001442 IP (tos 0x0, ttl 64, id 50844, offset 0, flags [DF], proto TCP (6), length 52)
   100.200.400.300:80 > 777.10.74.11.61211: Flags [.], cksum 0x2d01 (incorrect -> 0xfa25), seq 1, ack 397, win 59, options [nop,nop,TS val 4012360590 ecr 734012594], length 0
12:40:11.017065 IP (tos 0x0, ttl 64, id 50845, offset 0, flags [DF], proto TCP (6), length 2621)
   100.200.400.300:80 > 777.10.74.11.61211: Flags [P.], cksum 0x370a (incorrect -> 0x6872), seq 1:2570, ack 397, win 59, options [nop,nop,TS val 4012360605 ecr 734012594], length 2569: HTTP, length: 2569
    HTTP/1.1 200 OK
    Date: Tue, 10 Sep 2019 10:40:11 GMT
    Content-Type: application/json
    Content-Length: 2348
    Connection: keep-alive
    Vary: Accept-Encoding
    cache-control: no-cache
    vary: accept, accept-encoding, origin
The difference is obvious to the trained eye:
- curl:
POST /api/queues/%2Fclient… - Evotor:
POST /api/queues//client…
The problem was that in one case RabbitMQ had received a confusing //vhost, and in another case, it had received a recognizable %2Fvhost, which is quite expected behaviour when:
# rabbitmqctl list_vhosts
Listing vhosts ...
/vhost
In a related issue, the developer of RabbitMQ explains:
We will not be replacing %-encoding. It’s a standard way of URL path encoding and has been for ages. Assuming that %-encoding in HTTP-based tools will go away because of even the most popular framework assuming such URL paths are «malicious» is shortsighted and naive. Default virtual host name can be changed to any value (such as one that does not use slashes or any other characters that require %-encoding) and at least with the Pivotal BOSH release of RabbitMQ, the default virtual host is deleted at deployment time anyway.
The problem was solved on the Evotor side after we contacted them.
Case #4. PostgreSQL… with a shot of gin?
PostgreSQL has one valuable feature that is often overlooked. This story starts with complaints about an application running slow. The APM we use for this application (Atatus) showed the following picture:
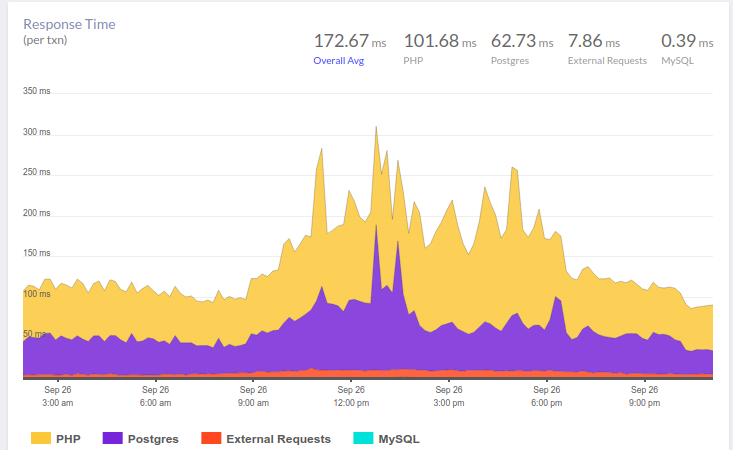
At 10 AM, there is an increase in database response time. As expected, the slowdown in the processing of queries is the primary reason for delays. As you might guess, analyzing queries, identifying problem areas, and indexing are all the usual stuff in our work. Here, the okmeter tool helps a lot providing standard panels for server monitoring as well as the ability to quickly create custom panels with the output of troubled metrics:
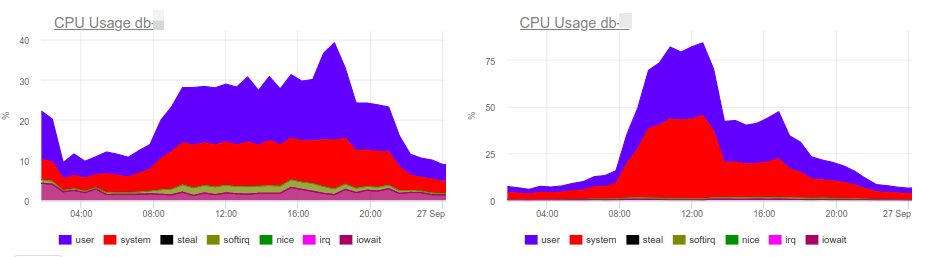
CPU load graphs indicate that one of the databases uses 100% of what’s available. Why? New PostgreSQL panel can help us to find an answer:
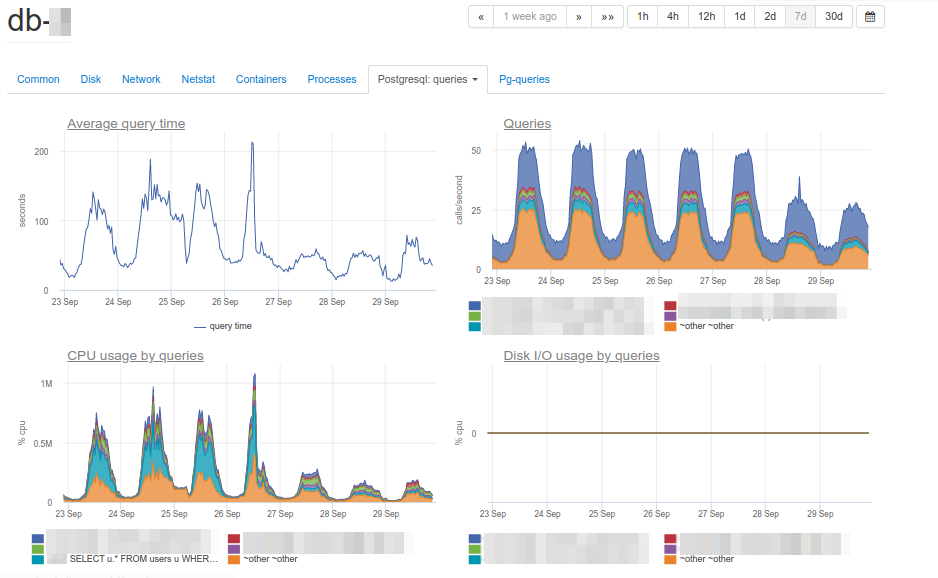
Now you can easily see the root cause of our problems. This query is the major consumer of CPU:
SELECT u.* FROM users u WHERE
  u.id = ? & u.field_1 = ? AND u.field_2 LIKE '%somestring%'
ORDER BY u.id DESC LIMIT ?
Analyzing the way the troubled query works, we have found out that filtering by indexed fields of a table produces a way too large sample: the database selects more than 70 000 rows by id and field_1 and then searches a substring among them. It turns out that LIKE by substring processes a large amount of text data, which leads to a critical slowdown in query execution and an increase in CPU load.
You might say that an architectural problem is evident here (one has to correct an application logic or to create a full-fledged text processing engine). Unfortunately, there is no time to fix this (as usual). In our case, the search word is an identifier (why it does not have its own field?), which returns only a few rows. If we could compose an index by this field, then all other fields would become unnecessary.
The temporary solution is to add a GIN index for field_2 (remember the gin mentioned above?). In short, GIN is a kind of index that speeds up the full-text search considerably. You can learn more about it, for example, in this excellent article.
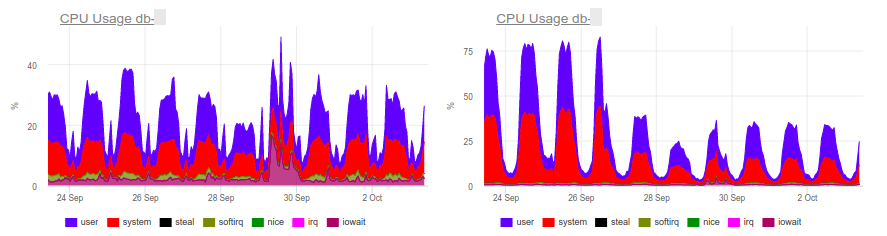
As you can see, this simple procedure removed the extra load on the CPU and saved money for the customer.
Case #5. Caching S3 with NGINX
S3-compatible cloud storage has long been an integral part of many applications. Amazon S3 is an excellent choice if you need to store pictures for your website or data for your neural network. Reliability, high data availability, proven solutions of S3 storage are really exciting.
To save money, you can deploy a caching proxy server in front of the S3 storage, since Amazon usually charges per requests or traffic. This method will help to reduce costs when it comes, say, to user avatars (there can be a lot of them on each page).
You can use NGINX to set up a proxy server with caching, re-validation, background updating, and other features. However, this approach (like any other) has its nuances and complications.
Here is an example of the configuration of the caching proxy:
proxy_cache_key $uri;
proxy_cache_methods GET HEAD;
proxy_cache_lock on;
proxy_cache_revalidate on;
proxy_cache_background_update on;
proxy_cache_use_stale updating error timeout invalid_header http_500 http_502 http_503 http_504;
proxy_cache_valid 200 1h;

location ~ ^/(?avatars|images)/(?.+)$ {
  set $upstream $bucket.s3.amazonaws.com;
  proxy_pass http://$upstream/$filename;
  proxy_set_header Host $upstream;
  proxy_cache aws;

  proxy_cache_valid 200 1h;
  proxy_cache_valid 404 60s;
}
Overall, this setup worked well: pictures had been displayed, the cache had worked fine. But there were some problems with AWS S3 clients. For example, a client app using aws-sdk-php had stopped working. The analysis of NGINX logs showed that upstream had returned error 403 for HEAD requests, and its reply had contained a specific error, SignatureDoesNotMatch. When we saw that NGINX makes GET requests to the upstream cluster, everything became clear.
The fact is that the S3 client signs each request, and the server checks the signature. With basic proxying, everything works fine: the request gets to the server unchanged. But when caching is enabled, NGINX starts to optimize backend traffic by replacing HEAD requests with GET requests. The logic here is obvious: it is better to retrieve and save an entire object, and then use cache for HEAD requests. However, in our case, you cannot modify the request since it is signed.
There are two possible solutions:
- Configure proxy bypassing for S3 clients;
- If the previous solution is unfeasible for some reason, then you have to disable the
proxy_cache_convert_headparameter and add$request_methodto the cache key. In this case, NGINX keeps HEAD requests intact and separately caches replies to them.
Case #6. DDoS and Google User Content
The Sunday evening was calm, when, all of a sudden, the cache invalidation queue on edge servers started to rise (these machines serve traffic to end users). This is very odd, given that all cache is stored in memory and doesn’t leverage hard drives. The architecture of the application allows easy flushing of the cache, so this error can only be triggered by a high load. The idea was confirmed by the servers, which began to notify us about 5xx errors (red line spikes on the graph below).
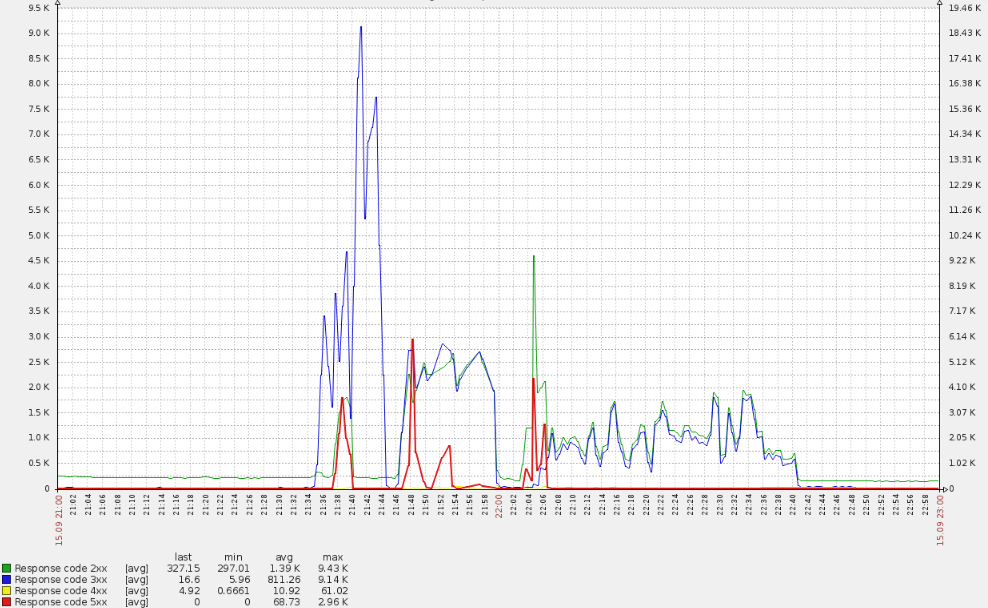
Such a sharp spike caused CPU overuse:
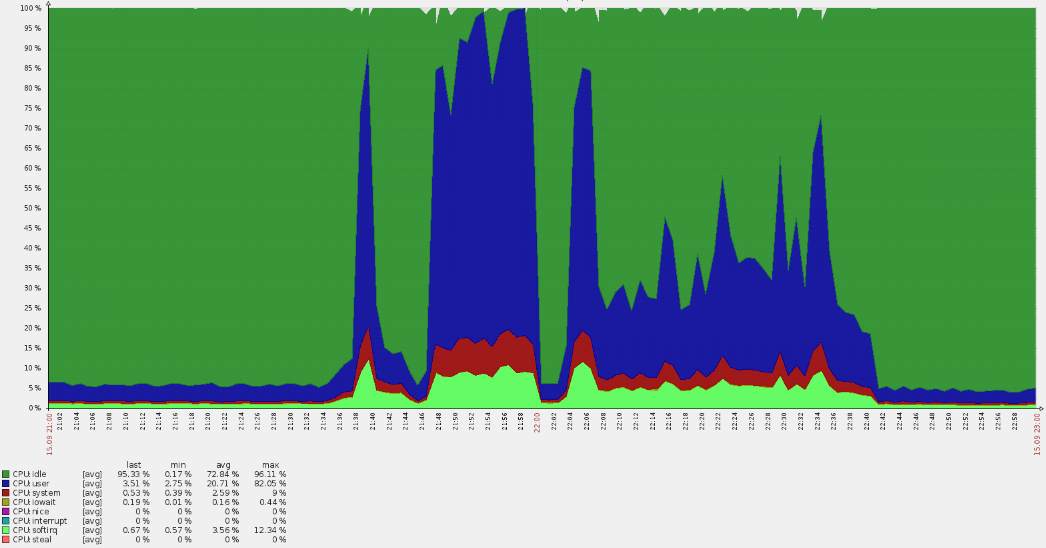
A quick analysis revealed that the requests bypassed main domains, and logs made it clear that they targeted the default vhost. Along the way, we have found that the majority of requests to this resource [primarily for European users] came from the USA, which is strange.
By analyzing NGINX logs, we have found that we were dealing with some botnet:
35.222.30.127 US [15/Sep/2019:21:40:00 +0100] GET "http://example.com/?ITPDH=XHJI" HTTP/1.1 301 178 "http://example.com/ORQHYGJES" "Mozilla/5.0 (Windows; U; Windows NT 5.2; en-US; rv:1.9.1.3) Gecko/20090824 Firefox/3.5.3 (.NET CLR 3.5.30729)" "-" "upcache=-" "upaddr=-" "upstatus=-" "uplen=-" "uptime=-" spdy="" "loc=wide-closed.example.com.undef" "rewrited=/?ITPDH=XHJI" "redirect=http://www.example.com/?ITPDH=XHJI" ancient=1 cipher=- "LM=-;EXP=-;CC=-"

107.178.215.0 US [15/Sep/2019:21:40:00 +0100] GET "http://example.com/?REVQSD=VQPYFLAJZ" HTTP/1.1 301 178 "http://www.usatoday.com/search/results?q=MLAJSBZAK" "Mozilla/5.0 (Windows; U; MSIE 7.0; Windows NT 6.0; en-US)" "-" "upcache=-" "upaddr=-" "upstatus=-" "uplen=-" "uptime=-" spdy="" "loc=wide-closed.example.com.undef" "rewrited=/?REVQSD=VQPYFLAJZ" "redirect=http://www.example.com/?REVQSD=VQPYFLAJZ" ancient=1 cipher=- "LM=-;EXP=-;CC=-"

107.178.215.0 US [15/Sep/2019:21:40:00 +0100] GET "http://example.com/?MPYGEXB=OMJ" HTTP/1.1 301 178 "http://engadget.search.aol.com/search?q=MIWTYEDX" "Mozilla/5.0 (Windows; U; Windows NT 6.1; en; rv:1.9.1.3) Gecko/20090824 Firefox/3.5.3 (.NET CLR 3.5.30729)" "-" "upcache=-" "upaddr=-" "upstatus=-" "uplen=-" "uptime=-" spdy="" "loc=wide-closed.example.com.undef" "rewrited=/?MPYGEXB=OMJ" "redirect=http://www.example.com/?MPYGEXB=OMJ" ancient=1 cipher=- "LM=-;EXP=-;CC=-"
The logs present a clear pattern:
- correct user-agent;
- a request to the root URL with a random GET argument to avoid a cache;
- the referrer header field looks like the request originated from a search engine.
First of all, we have decided to check the origin of web addresses. It turned out that they all belong to two subnets (107.178.192.0/18 and 34.64.0.0/10) of googleusercontent.com. These subnets are used for GCE virtual machines and various services, such as a tool for translating web pages.
Fortunately, the attack did not last long (like an hour or so) and gradually waned. It seems that the Google protective algorithms kicked in, so the issue has resolved itself.
The attack caused no damage. However, it raised some significant questions:
- Why didn’t the anti-DDoS system help? We use an external service for that and have sent an appropriate complaint to them (still, the pool of addresses was way too large).
- How to protect ourselves from this kind of attacks in the future? In our case, one of the options is to grant access depending on the geography of users.

Comments